Westchester Real Estate Market Q3 2026: Why County Averages Miss the Local Picture
The Q3 2026 Westchester market report shows Rye and Scarsdale moving very differently. Here is why county averages miss the local picture, and what it means for you.
The Q3 2026 Westchester County Market Report is out. The headline numbers are useful. But they can also be misleading if you are making a decision about one specific town.
Same county. Same nine months. Different stories.
Two Towns, Two Different Price Moves
Here is single-family data from OneKey MLS, comparing the first nine months of 2026 to the same period in 2025:
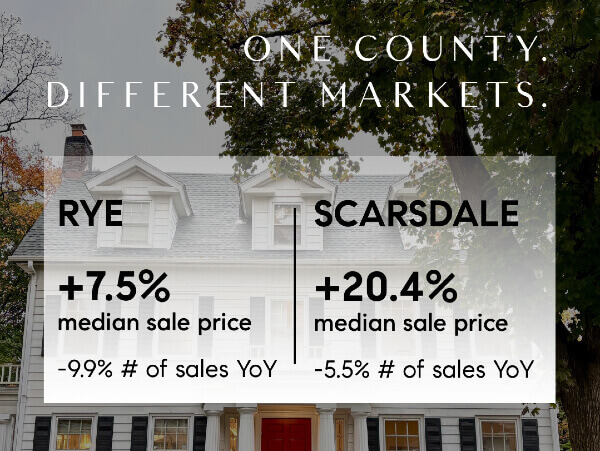
- Rye: median sale price up 7.5%, number of sales down 9.9%
- Scarsdale: median sale price up 20.4%, number of sales down 5.5%
Both towns saw fewer sales. Yet the median price moved by very different amounts.
These two towns are examples, not the whole story. The same kind of gap shows up across Westchester County.
County-wide, the median sale price for single-family homes was up 13.2% for the first nine months of 2026 compared to the same period last year, and the number of sales was down 6.1%.
What a Median Sale Price Actually Measures
A median is the middle sale price of all homes that sold in a period. It tells you which homes sold. It does not tell you what any single home is worth.
That distinction matters. Here is why:
- A town with fewer sales has fewer data points. One or two sales can move the median.
- If more higher-priced homes sell in a period, the median rises.
- If more entry-level homes sell, the median can fall, even when individual homes are holding value.
So a 20.4% jump does not mean every Scarsdale home gained 20.4%. It means the typical home that sold this year sold for that much more than the typical home that sold last year.
Why County Averages Miss the Local Picture
Westchester County covers dozens of towns and school districts. Each has its own housing stock, price range, and buyer pool.
A county-wide number blends all of them together. The result describes no single town well.
Local conditions that county data can hide include:
- The price points where most homes are selling
- How much inventory is available in your town
- Whether sales are concentrated in one neighborhood or spread out
- How quickly homes in your price range are going under contract
Here are the same numbers for a few more towns:
- Mamaroneck/Larchmont: median sale price up 11.3%, number of sales down 3.6%
- Harrison: median sale price up 39.2%, number of sales down 19.3%
- Bronxville: median sale price down 5.5%, number of sales up 8.3%
What This Means If You’re Buying
Start with your target town and price range, not the county headline. Ask for recent sales in that exact segment.
Also look at the number of sales behind any statistic. A big percentage change on a small number of sales deserves a closer look.
What This Means If You’re Selling
Your pricing strategy should come from recent sales of comparable homes near you. A county or even town-level median is only a starting point.
An agent with hyper-local knowledge can explain which sales are true comparables and which are not.
Frequently Asked Questions
Do rising median prices mean my home is worth more? Not necessarily. A median reflects the mix of homes that sold. A rising median can come from more higher-priced homes selling, not only from appreciation of individual homes.
Why do Westchester towns have such different numbers? Each town has its own housing stock, price points, and buyer demand. County statistics blend all of them together.
Where can I find market data for my specific Westchester town? Contact a local agent who can pull OneKey MLS data for your town, school district, and price range.
Want stats and trends for your area? Reach out and I’ll walk you through the numbers that matter for your town.
Source: OneKey MLS, single-family homes by school district, Q1-Q3 2026 vs. Q1-Q3 2025. Full report here.
914.715.2632